On this page
An application can be running while an important operational event is already hidden inside a local log file.
As application environments grow, logs can be spread across multiple servers, processes and system sources. Checking those files one machine at a time makes troubleshooting slower and makes it harder to understand what happened across the whole environment.
Centralized application monitoring addresses that visibility gap by bringing logs into one searchable operational layer.
Application monitoring is not simply collecting more logs. It is about making operational events searchable and useful when an engineer needs to investigate what happened.
01
The application visibility problem
Application and system logs often live on the same servers where the workload is running. That can be enough for a small environment, but it becomes increasingly difficult when several application nodes generate events at the same time.
Logs distributed across servers
Engineers may need to inspect multiple hosts to understand one production issue.
Different log sources
Application, authentication and system events may follow different files and formats.
Slow investigation
Manually locating the right server and time window adds unnecessary investigation steps.
Limited central context
Without centralized search, related events are harder to correlate across the environment.
02
What application monitoring answers
The purpose of centralized application monitoring is to give engineers a practical way to answer questions about application behavior and operational events.
What happened?
Search application and system events around the time of an incident.
Where did it happen?
Identify the host, source file or application instance associated with an event.
How often is it happening?
Use centralized log counts and time windows to understand event frequency.
Can we investigate it without logging into every server?
Centralized collection reduces the need to inspect each application server independently.
03
Centralized logging architecture
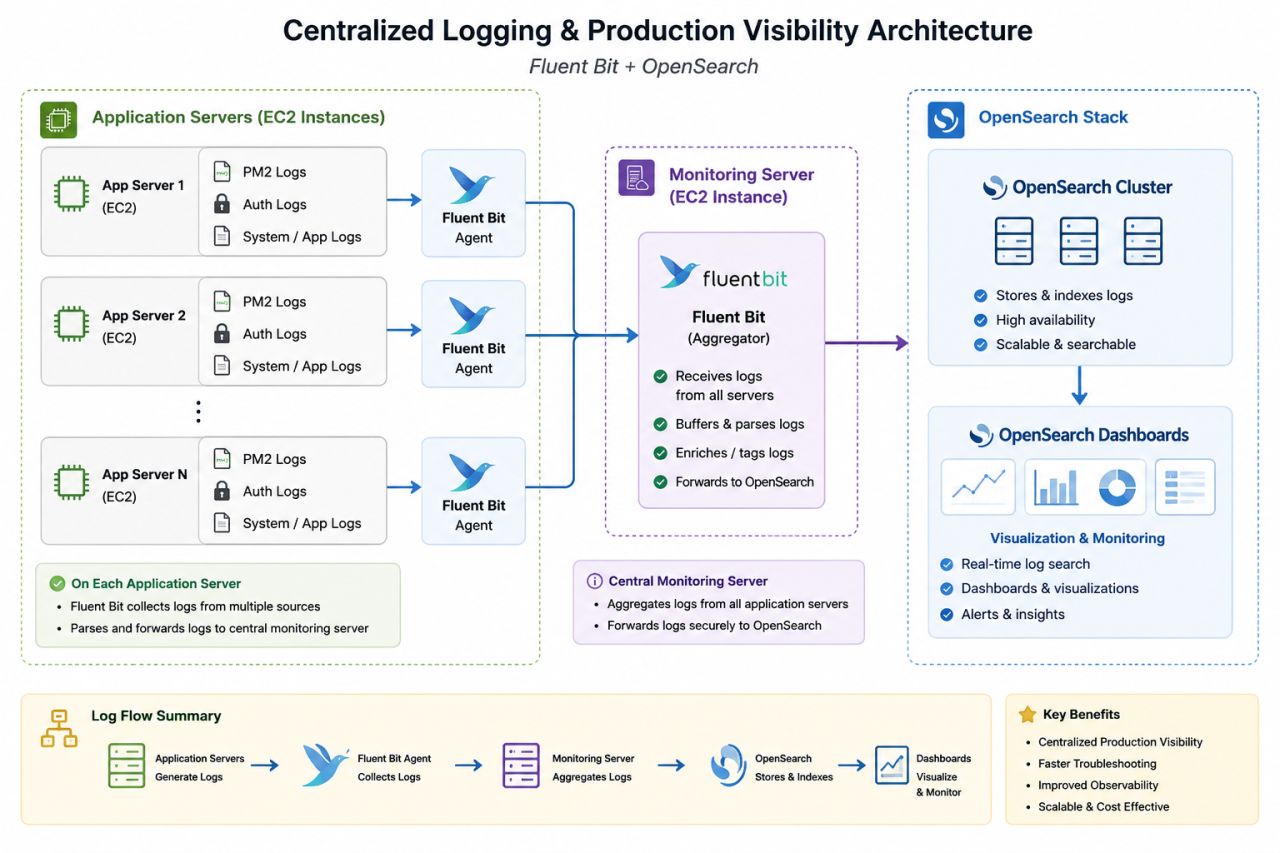
The implementation uses a clear pipeline: application servers generate logs, Fluent Bit agents collect them, a central monitoring layer aggregates them and OpenSearch stores and exposes the resulting data for search and dashboards.
04
What we collect
The architecture shown here collects multiple operational log sources from application servers rather than depending on a single application file.
PM2 logs
Application process output and runtime events generated by PM2-managed workloads.
Authentication logs
Authentication and operating-system access events that help with operational investigation.
System logs
Host-level events that provide additional context when application behavior needs investigation.
Application logs
Workload-specific events that explain application behavior beyond infrastructure metrics.
05
Fluent Bit: collecting and forwarding logs
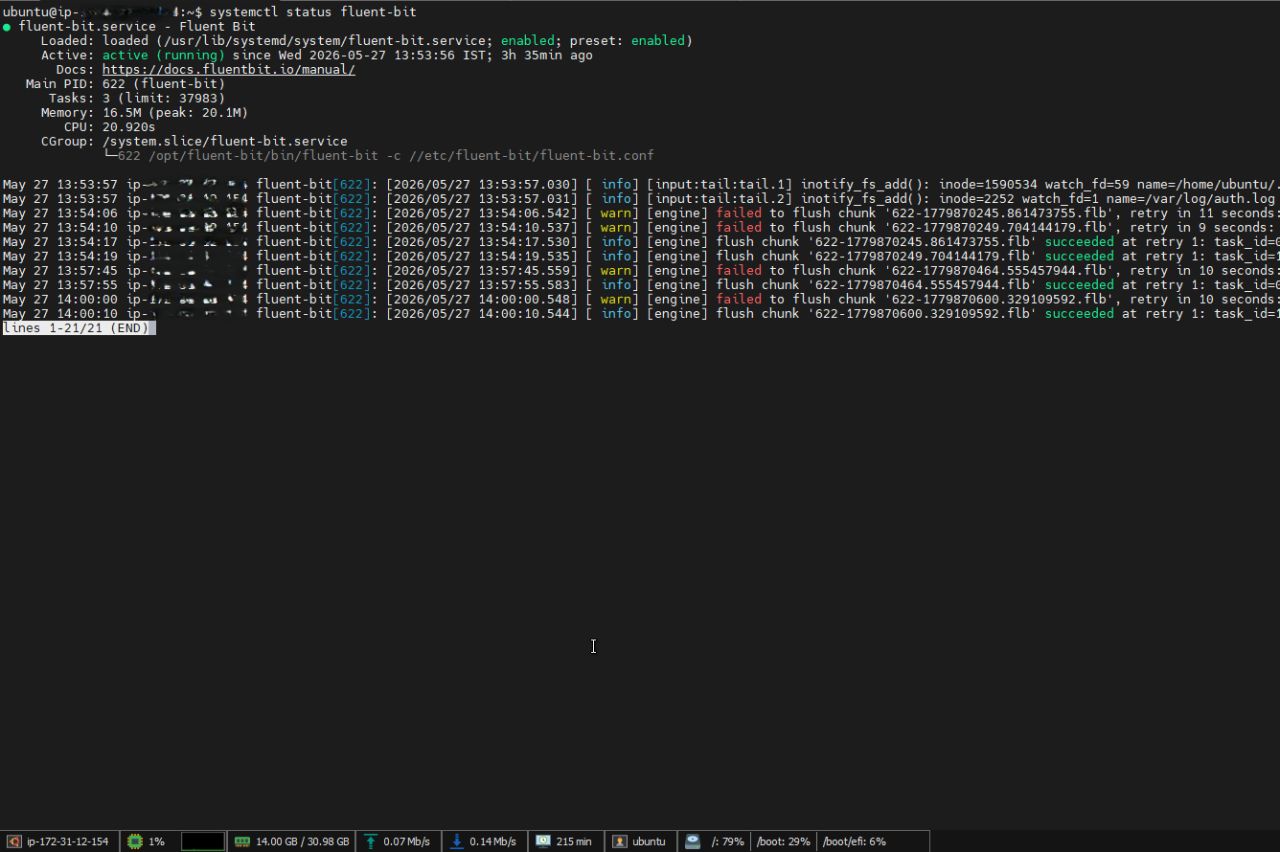
Fluent Bit acts as the collection layer on the application servers. It watches the configured log sources and forwards those events into the centralized monitoring workflow.
The collector should be treated as part of the production infrastructure. Its health and delivery path matter because centralized visibility depends on it.
06
OpenSearch: centralized search and visibility
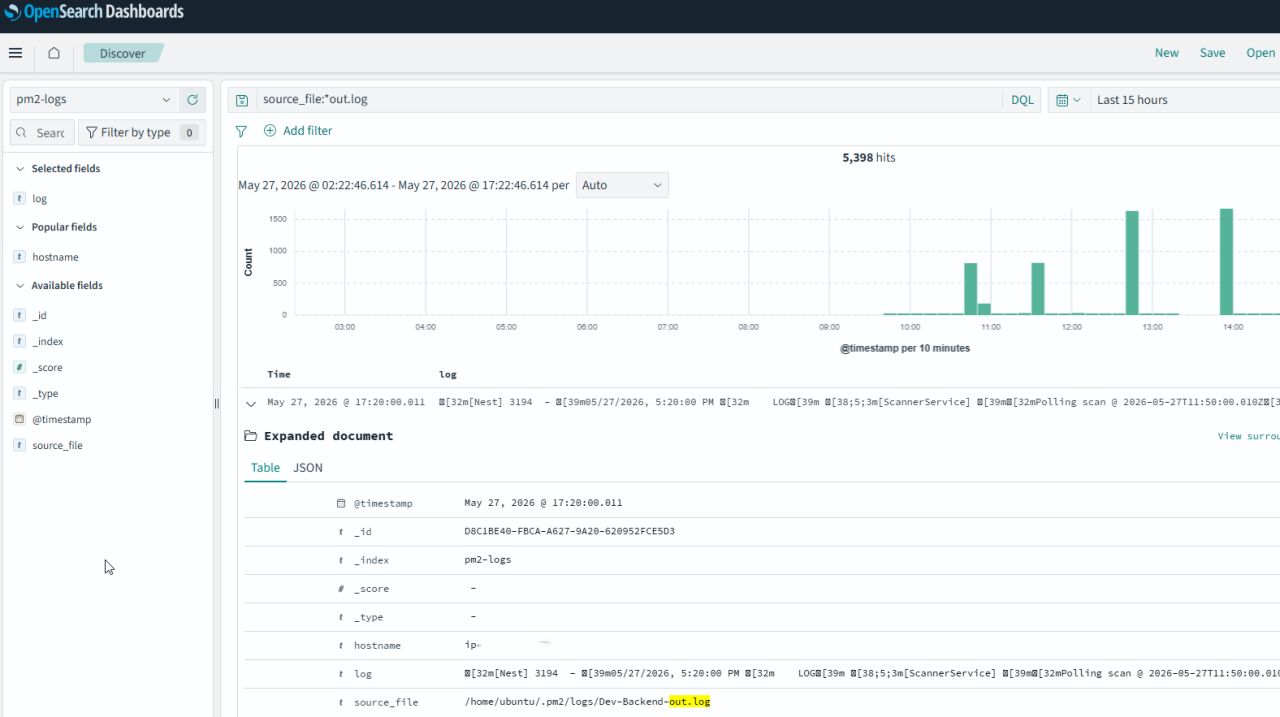
Once logs reach OpenSearch, engineers can search centralized application events instead of locating and opening log files on each server independently.
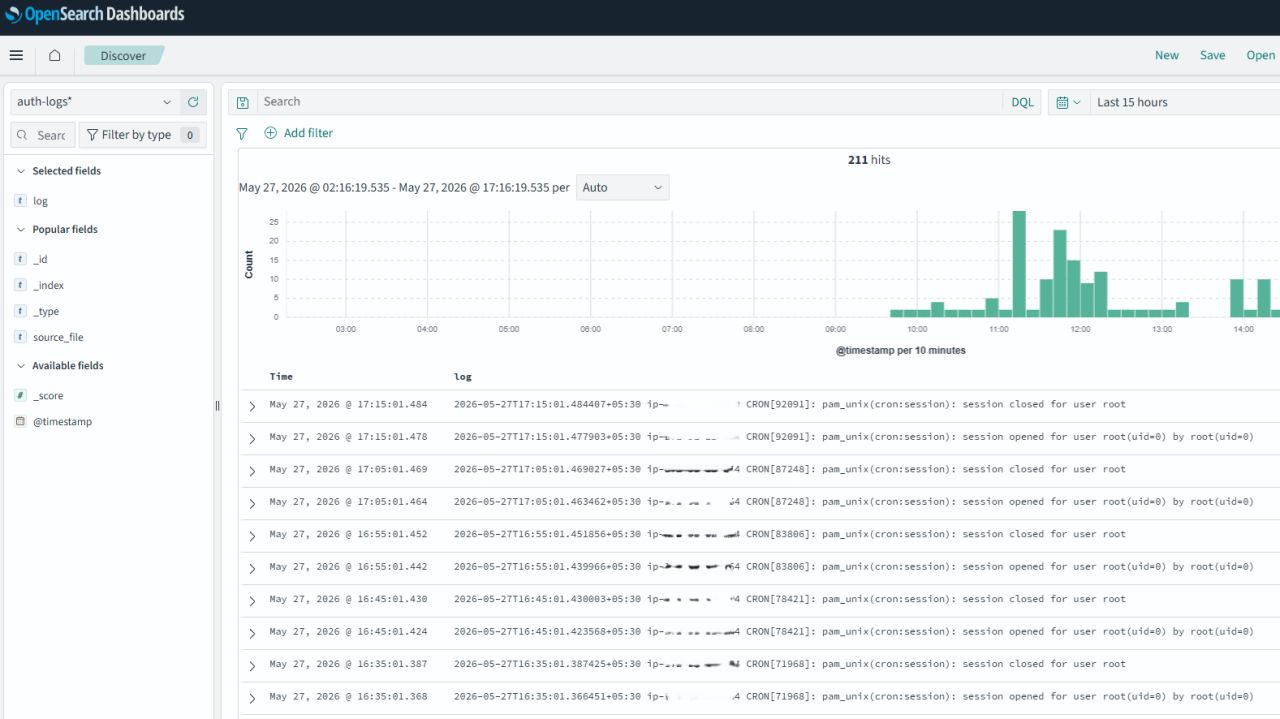
The captured environment includes searchable PM2 logs and authentication-related logs, giving the team a common place for operational investigation.
Centralized search
Query logs from multiple sources through one operational interface.
Time-based investigation
Narrow the investigation to the time window where an event occurred.
Application context
Inspect application-generated events alongside host and authentication signals.
Operational visibility
Give engineers a shared view of what is happening across the application environment.
07
Retention and operational control
Centralized logs are only useful when their lifecycle is controlled. The implementation uses an OpenSearch index lifecycle policy to define how long logs remain available.
Configured policy
A seven-day log retention workflow is defined so operational log data does not continue growing without a lifecycle policy.
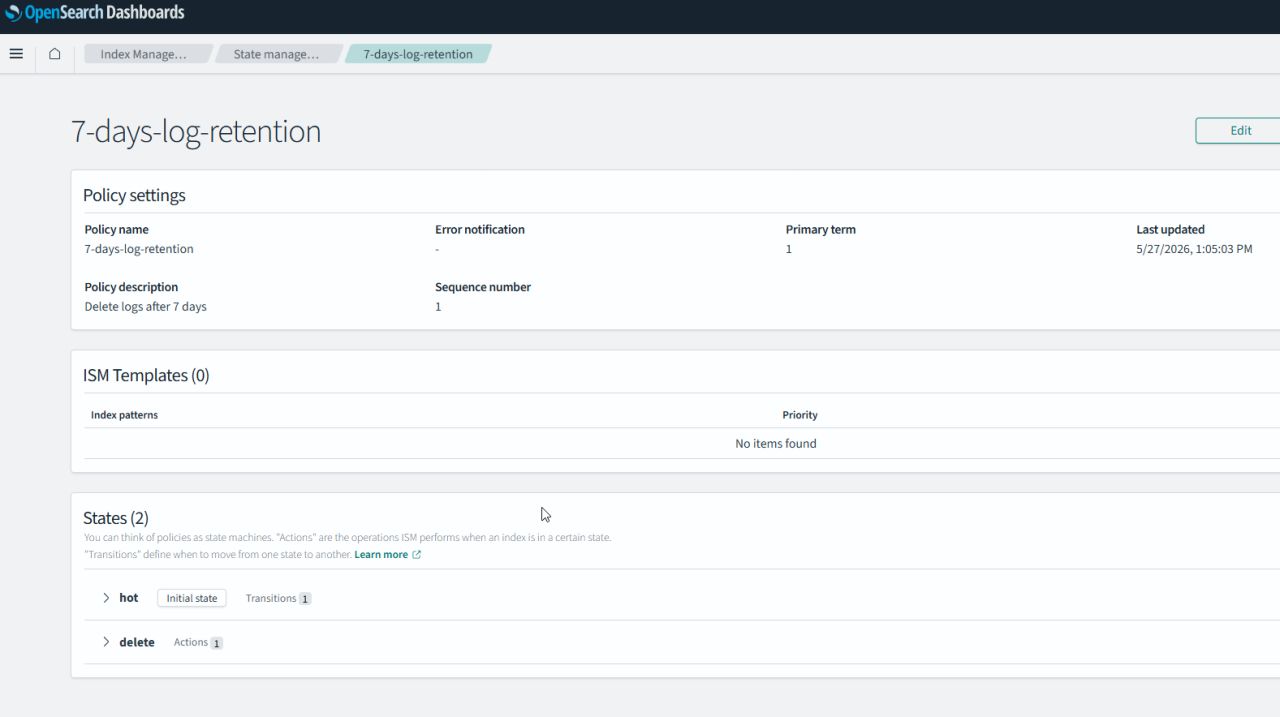
Retention should be aligned with investigation needs, storage capacity and the operational purpose of the logs rather than being left undefined.
08
Implementation in practice
The screenshots below show the monitoring stack in operation: the centralized architecture, the Fluent Bit collection layer, application logs in OpenSearch, authentication logs and the configured retention policy.
Centralized logging and production visibility architecture
Application servers generate PM2, authentication, system and application logs. Fluent Bit agents collect those logs and forward them through a central monitoring layer into OpenSearch for storage, search and visualization.
Centralized logs become significantly more useful when they are searchable, retained deliberately and available without requiring engineers to inspect every application server separately.
09
Production considerations
A centralized application logging platform should itself be treated as production infrastructure. The collection path, storage, access and lifecycle all need deliberate operational controls.
Collector health
Fluent Bit agents need to remain healthy so application events continue reaching the centralized layer.
Central storage capacity
OpenSearch storage should be sized around expected event volume and the defined retention window.
Retention
A clear lifecycle policy prevents logs from growing indefinitely and keeps storage behavior predictable.
Access control
Only appropriate engineers and operators should have access to centralized operational logs.
Searchability
Indexes, source fields and consistent naming should make investigation practical rather than forcing manual file inspection.
10
Application monitoring checklist
Collection
Centralized visibility
Retention
Operations
Engineering perspective
Centralized logs turn application events into operational visibility
Application monitoring is more than collecting log files. It is about creating a practical path from an application event to searchable evidence that an engineer can use during investigation.
In this implementation, Fluent Bit provides the collection layer, OpenSearch provides centralized storage and search, and a defined retention policy keeps the logging environment operationally manageable.
Good application monitoring reduces the distance between an operational event and the engineer trying to understand it.